





Data-Driven Forklift Safety
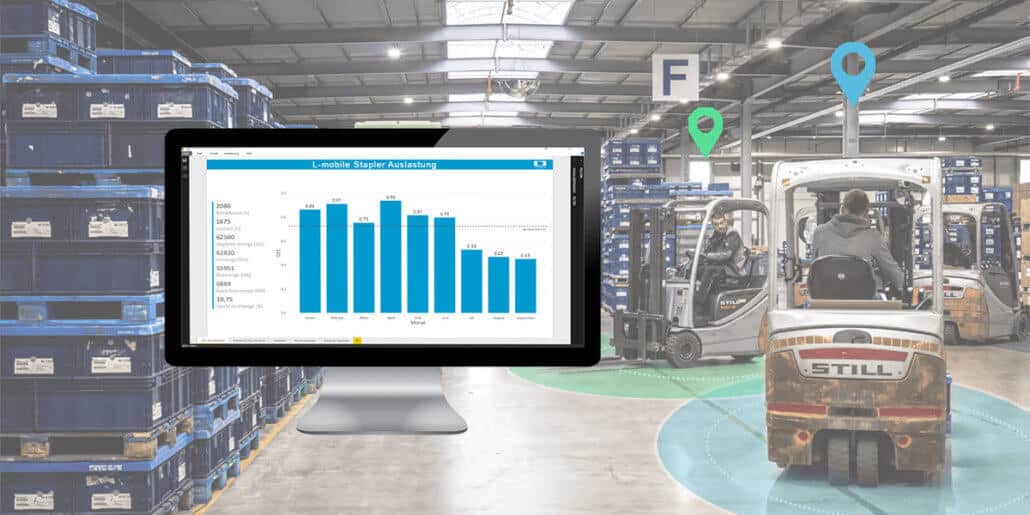
“Rules told us how people should drive. Data tells us how they do drive.”
— Industrial Safety & Operations Practice at Teknect.ai
Every safety manager knows the feeling. The incident report lands on your desk, the investigation begins, and one question dominates the room: Did we see this coming?
In most facilities, the honest answer is no. We had policies, training records and toolbox talks. What we did not have was visibility into what our forklifts and operators were actually doing between audits. Rules told us how people should drive. Data tells us how they do drive.
This article is written for safety, warehouse, plant, supply chain, maintenance and facilities professionals who share one responsibility: keeping people safe and operations moving. It explains how data-driven forklift safety shifts your program from reacting to incidents to preventing them.
The Real Cost of Reactive Forklift Safety
OSHA statistics indicate roughly 85 forklift fatalities and 34,900 serious injuries each year in the United States, with about 42 percent of the fatalities involving an operator crushed by a tipping truck (ISHN).
OSHA also estimates around 62,000 additional non-serious injuries annually (BigRentz). The powered industrial truck standard, 1910.178, ranked seventh among OSHA’s most frequently cited standards in fiscal 2018.
Those numbers describe people. The operational cost is just as real:
Injuries and Lost Time
Medical expense, replacement labor, investigations and workers’ compensation.Damaged Assets
Racking, product, dock doors, building structure and the truck itself.Unplanned Downtime
A single impact can idle an aisle, a line or a dock.Regulatory Exposure
Citations, penalties and the scrutiny that follows a serious event.Cultural Damage
Operators who feel watched but not supported, and supervisors who feel blamed without evidence.
Five Data Signals Every Forklift Program Should Capture
Data-driven safety does not mean collecting everything. It means capturing the few signals that predict harm, then tying each one to a decision. These are the five I would start with:
| Data Signal | What It Reveals | The Decision It Drives |
|---|---|---|
| Impact and collision events | Where, when and how hard trucks strike racking, structures and people-adjacent zones | Aisle redesign, guarding, targeted coaching, inspection triggers |
| Speed and travel behavior | Speeding, harsh turns, braking and travel patterns by zone and shift | Speed limits by zone, route changes, operator feedback |
| Pre-shift inspection results | Which defects are reported, skipped or repeated | Maintenance priorities, lockout of unsafe trucks |
| Operator access and certification | Who is driving which truck, and whether they are authorized | Training schedules, access control, accountability |
| Utilization and idle time | Truck hours, idling and fleet right-sizing | Fleet mix, battery and fuel planning, fewer trucks on the floor |
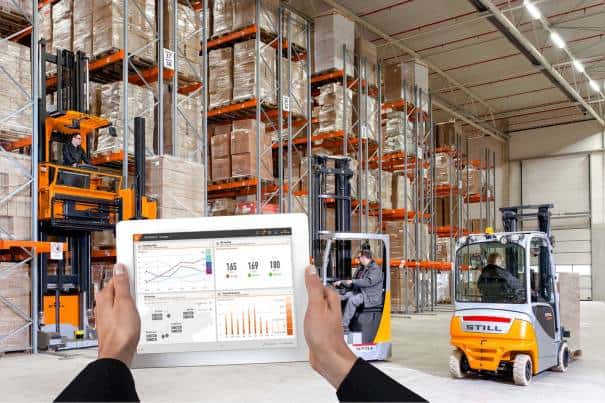
Together, these signals build a living picture of risk. Teknect.ai’s AI-powered forklift safety and fleet management systems are designed around exactly this principle: turn raw truck data into insight that safety, operations and maintenance teams can act on the same day.
From Data to Action: Leading Indicators and Fair Coaching
Collecting data is the easy part. The value appears when a signal becomes a conversation, a repair or a layout change within hours, not quarters.
Track Leading Indicators
Near-misses, impact counts per 1,000 operating hours, speed exceptions and skipped inspections tell you where the next incident is forming.Find the Hot Spots
Heat maps of impacts by aisle, dock and intersection often point to a design problem rather than a people problem. A blind corner generates repeat events regardless of who is driving.Coach with Evidence
Operators respond to specific, timely, factual feedback. Showing a driver a pattern in their own data is fairer and more effective than a generic reminder.Recognize Improvement
Publish trends by shift and zone. Celebrate the teams moving the numbers, and keep the focus on the process, not on blame.Close the Loop
Review the same indicators weekly. If a corrective action works, the data will show it. If it does not, you will know within days.This is what separates a data-driven program from a data-rich one. The first changes behavior and conditions. The second only fills dashboards.
What Forklift Data Means for Your Role
Forklift safety is not only a safety department issue. The same dataset serves every function that touches the floor:
| Role | What the Data Gives You |
|---|---|
| Safety and EHS | Leading indicators, documented compliance with OSHA 1910.178, and evidence for investigations and audits |
| Warehouse and plant operations | Fewer interruptions, zone-level speed and traffic insight, and faster answers after an incident |
| Supply chain and logistics | Reliable throughput, fewer damaged goods and dock delays, and better fleet capacity planning |
| Maintenance | Condition-based service triggers, early defect reporting from inspections, and impact history before a truck returns to service |
| Facilities | Impact data on racking, columns, doors and floors to prioritize repairs and layout changes |
| Operations leadership and finance | A defensible link between safety investment, uptime and total cost of ownership |
When these groups work from one shared source of truth, safety stops competing with productivity. The conversation changes from speed versus safety to how do we move more, safely.
Proving the Return and Rolling It Out in 90 Days
Leadership funds what it can measure. Build your business case on four numbers you can baseline in the first month:
- Recordable and near-miss events per 1,000 operating hours
- Impact-related repair and product damage cost
- Unplanned downtime hours tied to forklift incidents
- Inspection completion rate and time to repair a reported defect
A practical rollout looks like this:
Days 1 to 30, Baseline
Install on a pilot fleet, enable the five core signals and record where you stand today.Days 31 to 60, Act
Set zone speed limits, fix the top three impact hot spots and begin evidence-based coaching.Days 61 to 90, Scale
Compare results against baseline, share the wins across shifts and sites, and extend to the full fleet.Start small, measure honestly and expand on proof. That approach earns trust from operators, finance and the executive team alike.

Make the Next Incident the One That Never Happens
The most dangerous assumption in any facility is that no news is good news. Without data, a quiet month may simply mean the near-misses went unseen. With data, you can find the risk, fix it and prove it worked.
If you are ready to see how real-time forklift safety analytics can strengthen your program, Teknect.ai is ready to help. Book a walkthrough and we will map your fleet, your hazards and your fastest path to measurable results.
Ready to See the Data-Driven Approach in Action?
Explore how Teknect.ai’s AI-powered forklift safety and fleet management platform protects frontline workers while cutting unplanned downtime.
