





Every Lost-Time Injury Starts Long Before the Incident
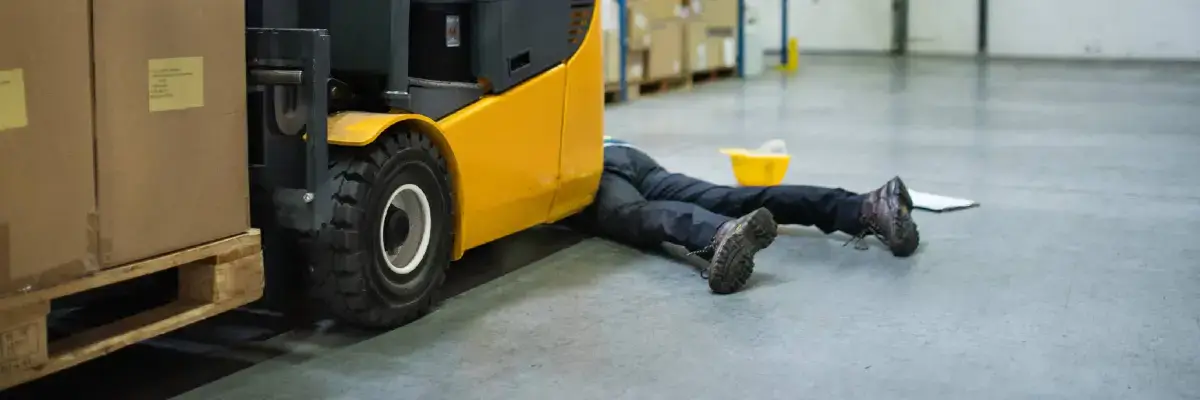
What Causes a High Lost-Time Injury Rate (LTIR)?
In my years as a safety manager, I have investigated enough incidents to recognize a pattern that rarely makes it into the final report.
Every lost-time injury starts long before the incident.
When we trace an injury back to its roots, there is almost always a warning. It was there in the weeks, days, or hours before anyone got hurt. We simply did not see it clearly enough, or we did not act on it quickly enough.
The Warnings We Learn to Ignore
Look back at any serious incident in your facility and you will likely find one or more of these common failure points:
-
A Near Miss: Discussed briefly during a morning toolbox talk and then forgotten.
-
A Recurring Unsafe Behavior: Such as speeding in a shared aisle or driving with an obstructed view, that no one formally addressed.
-
An Equipment Alert: Logged on a paper inspection form but never escalated to maintenance.
-
A Congested Aisle: Where pedestrians and forklifts routinely crossed paths without physical or visual separation.
-
A Risk Everyone Considered “Normal”: When a hazard becomes part of the daily routine, it stops looking like a hazard.
That last point is the most dangerous. Teams work around it. Supervisors walk past it. The organization slowly accepts a level of operational risk it would never approve on paper.

Why LTIR Alone Tells Us Too Little, Too Late
As leaders, we tend to evaluate performance through numbers delivered long after the fact: LTIR, recordable incidents, lost workdays, and workers’ compensation claims.
The lost-time injury rate remains a standard operational benchmark. In North America, it is calculated using the standard OSHA methodology:
LTIR = (Number of Lost-Time Injuries × 200,000) ÷ Total Hours Worked
The 200,000 figure represents the base benchmark for 100 full-time equivalent employees working 40 hours per week for 50 weeks per calendar year. This standardization lets organizations of varying sizes compare performance on an equal footing.
| Metric Type | Typical Indicators | Core Limitation / Advantage | Strategic Purpose |
|---|---|---|---|
| Lagging Indicators | LTIR, TRIR, Lost Workdays, Direct Workers’ Comp Costs | Tells you what happened after harm has occurred; non-preventative. | Executive compliance, benchmarking, insurance assessments. |
| Leading Indicators | Near-miss logs, DMS alert frequency, pre-shift defect flags | Demands systematic collection; captures precursor hazards before impact. | Incident prevention, process correction, active risk mitigation. |
LTIR is by definition a lagging indicator. It tells us how many people were hurt. It does not tell us how close we came to hurting others, or where the next severe injury is brewing.
The more useful question for any safety leader is not “What was our LTIR last quarter?”
It is: What were we not seeing before the injury happened?
Good Intentions Do Not Reduce LTIR
Every organization I have worked with wanted zero injuries. Intent was never the problem. Sustainable LTIR reduction occurs when organizations build three foundational pillars:
1. Visibility
The ability to see risk as it develops across shifts, not only after it results in harm.
2. Systems
Consistent, automated processes that turn observations into actionable data, and data into corrective intervention.
3. Accountability
Clear ownership workflows, ensuring that when an alert is triggered, an assigned stakeholder closes the loop.
Without visibility, operations manage by assumption. Without systems, near misses stay anecdotal. Without accountability, even well-documented risks stay open indefinitely.
Shifting from Lagging to Leading Indicators
Reducing LTIR requires prioritizing the proactive signals that emerge before the injury occurs. Essential leading indicators include:
- Near-miss frequency and spatial hotspot location.
- Repeat unsafe operator behaviors categorized by zone, shift, or equipment fleet.
- Pre-shift inspection completion rates and failed component logs.
- Machine-to-infrastructure impact and proximity collision alerts on material handling equipment (MHE).
- Pedestrian–vehicle interaction events in high-traffic loading bays.
- Mean time to complete and verify corrective safety actions.
The operational bottleneck is that many of these signals are difficult to capture reliably by hand. A supervisor cannot monitor every aisle on every shift. Paper checklists get pencil-whipped. Minor near misses go unreported because no property was broken and no worker was visibly injured. This is exactly where modern technology earns its place.

Where Technology and AI Fit In
Let me be clear about what artificial intelligence is not. It is not a replacement for dedicated safety professionals, frontline supervisors, or certified equipment operators. Safety culture is built and preserved by people.
What technology provides is an unblinking layer of continuous visibility—one that monitors every shift and aisle without fatigue.
What Proactive Safety Looks Like on the Warehouse Floor
In material handling environments, forklift–pedestrian interactions remain one of the highest-consequence risks safety leaders manage. The table below illustrates how Teknect.ai’s safety suite maps directly to these operational warning signs:
| Unaddressed Risk Signal | Applied Technology | Practical Floor-Level Impact |
|---|---|---|
| Near Misses & Congested Aisles | TK300 AI Anti-Collision System & Ultra-Wideband (UWB) Pedestrian Detection | Delivers dual real-time proximity alerts to both drivers and pedestrians while recording precise location telemetry for traffic-flow redesign. |
| Recurring Unsafe Behavior | Driver Monitoring System (DMS) | Tracks fatigue, cell-phone distraction, and unsafe driving postures with edge-computed video feeds, enabling targeted coaching. |
| Ignored Equipment Alerts | doCheck Digital Pre-Shift App | Replaces paper forms with mandatory digital vehicle checklists that automatically lock out defective equipment. |
| Normalized Workplace Risk | Fleet Management System (FMS) | Consolidates vehicle impacts, geofence breaches, and runtime metrics into a single real-time operational dashboard. |
| Load Instability & Tip-Overs | Load Management System (LP-S1) | Measures mast load, center of gravity, and tilt limits dynamically, sounding alarms before an unbalanced lift results in an overturn. |
Individually, each module closes a distinct blind spot. Together, they supply EHS leaders with a synchronized, data-backed operational picture.

Why This Matters to the CEO, Not Only the EHS Team
For executive leadership, LTIR carries implications far beyond statutory compliance. Behind every lost-time incident is a ripple effect that touches every balance sheet item:
- People: An employee and their family endure physical disruption, pain, and lost livelihood.
- Operations: Unplanned downtime, mandatory regulatory inquiries, and lost throughput.
- Assets: Sustained structural damage to racking, inventory spoilage, and capital equipment loss.
- Financials: Direct workers’ compensation payments, plus severe indirect expenses like temp labor premiums, overtime, legal retainers, and rising insurance modifiers.
- Culture: Weakened psychological safety and eroded employee trust in management’s stated values.
Organizations that invest in early visibility prove that productivity and safety move together, rather than competing for priority.
The Best Safety Outcome
After every serious incident, we write a report. We catalog root causes, assign corrective action items, and share lessons learned across plants. That work matters.
Yet the best safety outcome is never an exceptional post-incident analysis.
It is the incident that never happens.
Frequently Asked Questions (FAQ)
-
What is a good Lost-Time Injury Rate (LTIR)?
An average LTIR varies by sector (typically between 1.0 and 3.0 according to Bureau of Labor Statistics industry averages for warehousing and manufacturing). However, top-quartile operations target an LTIR as close to 0.0 as possible by monitoring leading safety indicators to resolve hazards before lost workdays occur. -
How do leading indicators reduce LTIR?
Leading indicators pinpoint unsafe conditions, close calls, and mechanical defects while they are still zero-harm events. By resolving these root causes immediately, companies eliminate the failure sequences that culminate in lost-time injuries. -
Can AI replace safety managers on the warehouse floor?
No. AI acts as a visibility multiplier, handling real-time telemetry, proximity tracking, and automated reporting. Safety managers leverage these automated data streams to make better strategic decisions, direct operator coaching, and eliminate recurring hazards.
Take the Next Step
Want to uncover which early warnings your facility is missing? Contact the Teknect.ai team to schedule an on-site safety assessment and evaluate how AI-powered visibility drives down LTIR and eliminates floor hazards.
Schedule a Safety Assessment